


Kejriwal ads…a journey to hilarity
Drama Queen, the song starring Sidharth Malhotra and Parineeti Chopra in the movie Hasee to Phasee was a hit with its catchy lyrics and Vishal-Shekhar music. But there has been a ...
Drama Queen, the song starring Sidharth Malhotra and Parineeti Chopra in the movie Hasee to Phasee was a hit with its catchy lyrics and Vishal-Shekhar music. But there has been a ...
The Delhi situation is far from satisfactory. Delhi Government is busy fighting the Union Government bureaucrats, MCD, Lieutenant governor (ex and Current), Delhi Police, even bad omens and EVM Machines. In ...
The forecasts for this year’s monsoons may be gloomy, but it will be sensible to assume that the forthcoming monsoon session in the parliament is going to be a heavy downpour ...
I respect a lot of people for their entrepreneurial talents. Kamal R Khan and Anna Hazare would be my two most favorite unconventional entrepreneurs. No don’t get me wrong, this is ...
Indians are news junkies. They love reading news, they love sharing their opinions and they love to disapprove the perspectives of others. With more than 75,000 newspapers and well over a1000 ...
Two major things happened on the 25th of June. One, India marked 40 years of the emergency imposed by the Indira Gandhi government. And two, India launched the Smart City project. ...
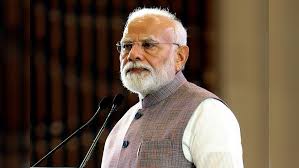
I have just one question. Mr Prime Minister, what you say must carry weight. You said 'na khaoonga, na khane doonga'. What happened to that? Said Rahul Gandhi version 2.0. Good, ...
According to Wikipiedia, A pie chart (or a circle chart) is a circular statistical graphic, which is divided into slices to illustrate numerical proportion. In a pie chart, the arc length ...
Lord Arvind Kejriwal speaks to his devotees, perched on a platform. He towers over his worshipers and names the corrupt-the scum of Indian politics. The corrupt, who must be hounded and ...
Dear Sir, I hope you are riding high on your new found glory in Indian Television. I also hope you are basking in the glory of the ‘intellectual’ tag that will ...
Thanks to the Media which is perennially suffering from Diarrhoea as far as making and selling news is concerned, Sadhus and Shankaracharyas, claiming to represent Hinduism, have started becoming a part ...
In school, I was taught that India was a great country that had arrived on the world scene; I was told that the world was looking towards us with hopes and ...
and never miss an insightful take by the TFIPOST team