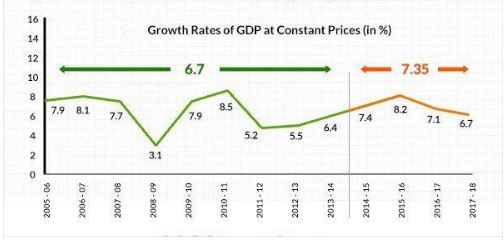
The new GDP back series data by Central Statistics Office (CSO) has busted the myths of UPA era growth. According to new data, the average GDP growth in one decade of UPA era was 6.7 percent while under NDA government has been 7.35 percent per year.
Back series released today by CSO has been checked for its methodological soundness by leading statistical experts in the country. #NITIAayog had organized two Round Tables in which domain experts participated to ensure the quality of coverage and methodology. pic.twitter.com/xfVC56NlVN
— NITI Aayog (@NITIAayog) November 28, 2018
The highest GDP growth achieved under UPA era was 8.5 percent while the lowest growth stood at 3.1 percent. The data was released in a joint press conference by NITI Aayog and Central Statistical Office (CSO). “The GDP growth rates for financial years 2006 to 12 have been revised using new back series data,” Chief Statistician Pravin Srivastava said at the press conference.
“Back series released today by the CSO has been checked for its methodological soundness by leading statistical experts in the country,” NITI Aayog said in a statement. The new series has significant methodological improvements. “The new GDP series is superior than older one,” NITI Aayog Vice Chairman Rajiv Kumar said.
Some people from left-liberal establishment criticized the new GDP growth data and raised questions on the credibility of NITI Aayog. Senior Congress leader and former Finance minister P Chidambaram led this cabal.
I wonder if Niti Aayog Vice Chairman Rajiv Kumar will agree to a debate the data than telling journalists that their questions are "undeserving of an answer".
— P. Chidambaram (@PChidambaram_IN) November 28, 2018
Govt had promised to release GDP back-series for comparability, but now to hide the poor shape the Economy is in, it will not be released. pic.twitter.com/eYdNvAxUba
— Sitaram Yechury (@SitaramYechury) March 7, 2017
https://twitter.com/rupasubramanya/status/1012296294239473664
India's GDP reached a rate of 9.5% from 2005-2008. #AccheDin means celebrating 7.2% after a self-inflicted Modi slump.
Moreover as @SalmanSoz points out, FM has to release back series data for new method of calculation of GDP
The economy may be doing much worse than we realise! https://t.co/h0oJy2LP6B
— Rajeev Gowda (@rajeevgowda) March 1, 2018
Rajiv Kumar himself clarified that both data had methodological differences and both are correct. However, the new methodology better represents overall outlook of growth data for the UPA era.
In August, a committee on real sector statistics headed by N.R. Bhanumurthy, a professor at the National Institute of Public Finance and Policy (NIPFP), concluded that the economic growth touched double digits twice under Manmohan Singh government. The committee has accepted that these numbers are experimental and indicative and final figures will be calculated soon. The final calculations were examined by the advisory committee on National Accounts Statistics before it is finally vetted by the National Statistical Commission. But leaders of the Congress party instantly came out to claim credit for the economic growth.
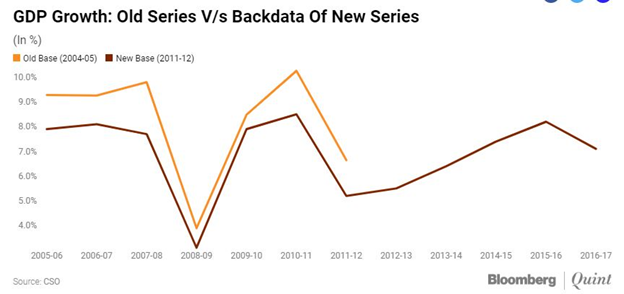
UPA government tried to sustain GDP growth which got momentum even when global environment was unsupportive given the financial crisis of 2007-08. The measure UPA government used was stimulus package through budgetary deficit and exuberant lending to corporates. This propelled GDP growth for a year, later macroeconomic conditions worsened and this resulted in economic slowdown in last three years of UPA government. The exuberant lending benefited only corrupt bankers and willful defaulters and resulted in NPAs.
“The new back series of GDP data highlight the volatility of Indian economic growth, with intermittent peaks in the pace of growth followed by dips. This suggests that sustaining a growth in excess of 8 percent over an extended period of time may pose a challenge, particularly in the absence of a secularly supportive global growth environment,” said Aditi Nayar principal economist at ICRA.
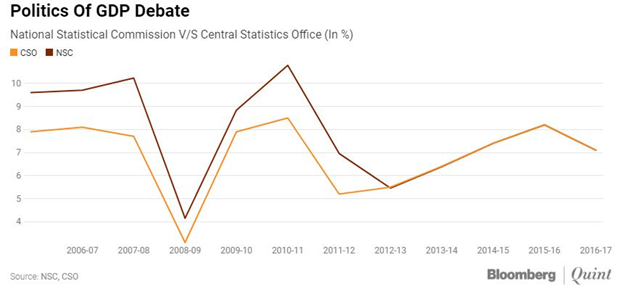
The credibility of new data was verified by economists across the political spectrum. The other macroeconomic indicators like savings rate, investment rate, and consumption trends supported the new GDP growth data. “Barring FY 08, annual GDP year-on-year growth trend hasn’t changed. Even this data also shows deceleration in investment rate from 39.8 percent in FY 11 to 30.6 percent in FY 18 and decline in gross savings rate to 29.6 percent in FY 17 from 36.2 percent in FY 11. These are the major economic challenges which Indian economy is currently facing,” said Devendra Kumar Pant Chief economist at India ratings.
The economic growth in initial years of UPA government was supported by the economic reforms of Vajpayee era. When the first Vajpayee government came to power, the macroeconomic fundamentals of the country were in shambles. The fiscal deficit was at 5.8 percent, CPI inflation was at 6.8 percent, Current Account Deficit (CAD) was at 1.3 percent and foreign exchange reserves were just 29.4 billion in the fiscal year 1997-98. So the country was weak on every major macroeconomic indicator. But when Vajpayee government was voted out of power the country had one of healthiest macroeconomic fundamentals. In the fiscal year 2003-04, the fiscal deficit was 4.5 percent of GDP, CPI inflation was 3.9, CAD was at 2.3 percent surplus, and foreign exchange reserves were at 113 billion (four times 97-98). Therefore the economic growth in initial UPA was direct result of the Vajpayee era policies however Congress leaders jumped at the opportunity to take credit for the same.


