
Gujarat model was discussed a lot in 2014 general election and BJP Prime Ministerail Candidate Narendra Modi eventually swept the poll showcasing his development model, consequently, after 30 years a single party was able to get absolute majority in the Lower House of the Parliament. In 2017, when state assembly election is due in Gujarat, Gujarat Model is yet again a major of discussion. The subject became even more prominent when Congress Vice President Rahul Gandhi accused that the development in Gujarat under BJP rule has gone crazy (Vikas Gando Thayo Che)
But if subtract the din around this much touted model and do an unbiased study of the numbers, the efficacy (or the failure) of the Gujarat model becomes all the clearer. So here’s my own analysis wherein I compare the performance of the major states of India.
The Candidates:
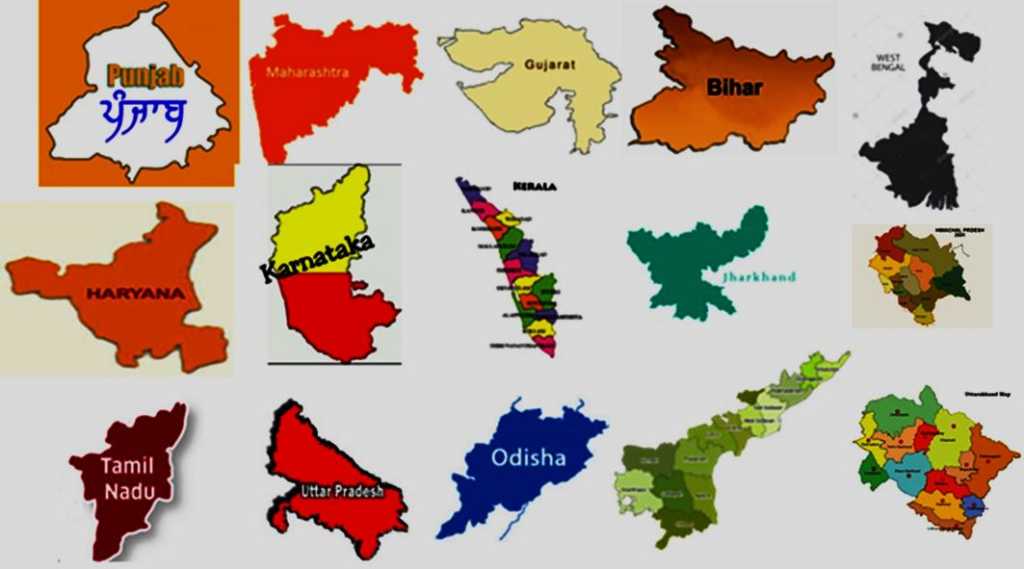
I excluded smaller states like Goa as their administrative and demographic situations are completely different. I chose not to include the Union Territories (UTs) as Central government intervenes significantly in their affairs. I kept aside Jammu & Kashmir as this state has got a different constitutional provision altogether. In short, I omitted small, extra-ordinary states and UTs to make my analysis consistent. In order to reach to a coherent set of candidates (states), I set population of the state as the parameter. I included only those states whose population is more than 2 crores as per Census 2011. There are 17 states which satisfy this condition, also this criterion automatically removes the small and exceptional states and UTs from the list.
Methodology:
The period of analysis is from 2011 to 2014, the last 4 Years of Narendra Modi as the Chief Minister of Gujarat. Narendra Modi is currently the Prime Minister of India, but he is still the tallest figure i Gujarat politics. So, I deliberately chose the recent period when the Gujarat strong man was ruling the state. An important point to note is that Telangana was not created in that period.
The overall condition of a state is dependent on economic as well as social indicators. I chose 5 indicators, 3 to measure economic performance and 2 to evaluate social performance of a state.
Economic indicators – Per Capita Income, Road Density and Capacity of Electricity Generation
Social indicators – Literacy and Crime Rate
Per capita income is the most important indicator to understand the economic condition of the people of a state. Per capita Net State Domestic Product (NSDP) at constant (2004-05) prices has been used as a proxy to measure per capita income. It is calculated by dividing the NSDP of the state by its population. The per capita NSDP at constant prices data has been taken from Reserve Bank of India (RBI). The average of the per capita income for year 2011-12, 2012-13 and 2013-14 is calculated for final reporting to counter fluctuations, if any in a year.
Infrastructure is the backbone of any economy. Empirically, it has been proved that when distance shrinks, economy grows. Nitin Gadkari, minister of road transport and highways often quotes former American president John F. Kennedy to underline the importance of roads. “American roads are not good because America is rich,” he quotes. “But America is rich because American roads are good.”
Road density is used as an indicator to evaluate the infrastructural development of a state. It is the length of the State highways (SH) in kilometre (km) per thousand km2 of area of the state. State highways link important cities, towns and districts within a state and connect them with National highways (NH) or highways of neighbouring states. SH are developed and maintained by the state government, so only length of SH is considered for analysis and not the length of NH, which is under control of National Highways Authority of India (NHAI). The data on road length has been taken from Roads-Statistical Year Book India 2017 (Ministry of Statistics and Programme Implementation, MOSPI) and the data on area has been pulled from Census 2011. The average of the length of the road of year 2012, 2013 and 2014 are taken for final analysis.
The next most important attribute of economic development is electricity. Industries need it for production and households need it for availing basic facilities. It is a fact that a power deficient state cannot progress. Electricity generating capacity in Mega Watt (MW) per lakh population is calculated to evaluate the power condition of a state. The total energy capacity is the sum of the energy generated by Hydro, Thermal, Nuclear and Renewable sources. The data on electricity as on March 2013 has been taken from Energy Statistics 2014 (MOSPI) and the data on population from Census 2011.
Education is one of the most important tools to transform a country. One needs to be educated to find or create jobs. Providing education in a country like India with more than 120 crores of population is crucial as well as a challenging. Literacy is considered as a fundamental proxy to measure the education profile of a state. Literacy rate is the percentage of the population of an area where people aged 7 or above can read and write with understanding. The data on literacy has been reported from Census 2011.
Crime against women is one of the most shameful things we face as a society, today. It reflects the status of women who constitute around 50% of the masses as well as the robustness of the administrative mechanism of the state. Rape is a heinous crime, punishable under section 376 of the Indian Penal Code (IPC). Crime rate (IPC 376) is the incidence of rape per one lakh population of women in that state. The data on crime rate has been taken from National Crime Records Bureau. The average of crime rate of year 2011, 2012 and 2013 has been calculated for final reporting to moderate fluctuations, if any in a year.
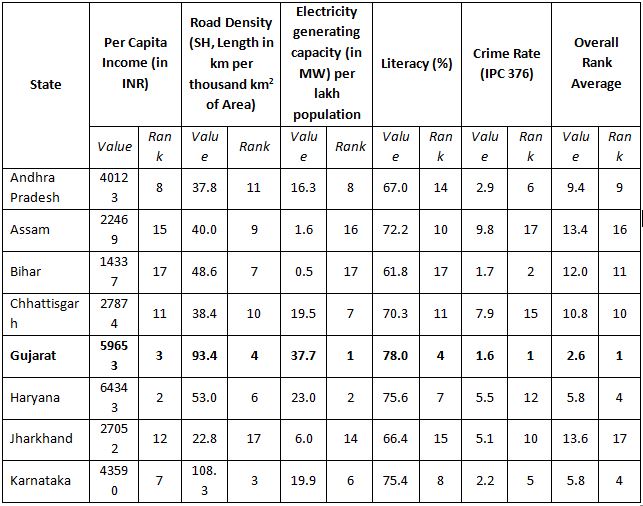
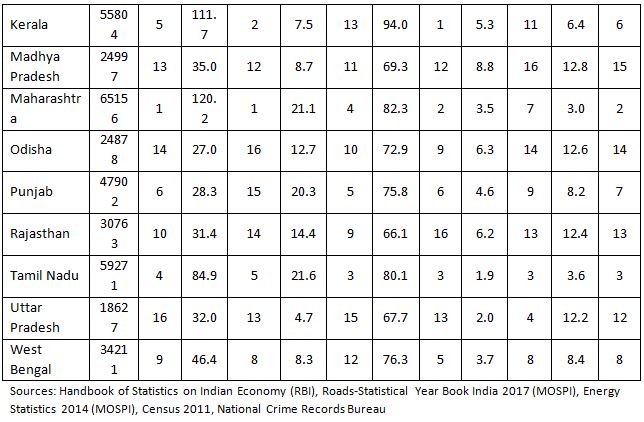
In the table below, the values for all these indicators are shown along with the corresponding state ranking based on those values. The average of the ranks of all indicators for a state is calculated and finally ranked to determine the final position of the states.
Table: Inter-state performance comparison based on Economic and Social indicators


Conclusion:
Per capita income is highest in Maharashtra (INR 65156) and lowest in Bihar (INR 14337), whereas Haryana (INR 64343) and Gujarat (INR 59653) are placed at number 2 and 3 respectively. Maharashtra is at top in road density with 120 km per 000’ km2 of area, whereas Jharkhand is at bottom, 22.8. Gujarat is placed at number 4, with 93.4 km per 000’ km2 of area. Gujarat has the highest electricity generating capacity, 37.7 MW per lakh population, whereas Bihar has the lowest, 0.5. Haryana with 23 MW per lakh of population is at number 2 in the ranking but way behind Gujarat. Kerala got the highest literacy rate, 94% and Bihar, the lowest, 61.8%. Gujarat is placed at number 4 in the table with a rate of 78%. Gujarat is the best place for women with lowest crime rate of 1.6 and Bihar is the second-best place, 1.7, whereas Assam is the worst place for them with a crime rate of 9.8.
In the overall ranking based on these attributes, Gujarat tops the chart followed by Maharashtra and Jharkhand secures the last position.
BJP is ruling Gujarat continuously for 22 years, out of which the government was headed by Narendra Modi for a significant 12 years. The data suggest he made Gujarat, inarguably the best place to live in India.