

In 2006, there was a nice 72-page report published by the erstwhile Planning Commission titled ‘Development of Jammu & Kashmir Growth Generating Initiatives’. The report summarized multiple avenues of growth for Jammu & Kashmir (J&K). The report, as usual, was quite insightful, given that Dr. C. Rangarajan, and had eminent members such as Sunil Mittal, Analjit Singh, Dr. D. Subarao, among others. The following write up is a mix of inputs from the Planning Commission Report, J&K Budget Documents, J&K Economic Survey Reports and our commentary.
The opening line of report are brilliant: ‘Long-term development of Jammu and Kashmir (J&K) is a formidable challenge in many ways. The state has to reconstruct an economy ravaged by two decades of militancy (now make that three decades) and terrorism and at the same time deliver quickly on growth and poverty reduction which, in the ultimate analysis, is the most sustainable solution to restoring peace and order’.
This line shall forever be the guiding light in undertaking development initiatives in J&K. In fact, prolonged crisis in the region will keep increasing the cancer in the region. The need to develop the region will be imperative. Brining the region, its population in the mainstream will be critical.
What is notable is despite 10 years passed since the report was published, there seems to be no major change. Reading the Economic Survey of the State published for 2014-15, it points to serious issues at the state. The usual culprit is ‘infrastructure development’ which remain abysmal. In fact, the state GSDP growth lags the national average. This is just the starting point; internally there are more issues such as inadequate healthcare, educational problems, no growth in industries, prevalence of sick industries, dependence on tourism, among others. The state has been in a bad shape since time immemorial. The reason can be multi-fold probably to do with State’s lethargy or center’s lethargy or just waiting for things to cool down before they do anything great. No point blaming anyone, the point is how to go ahead. For that, let’s look at the key issues and then try to bring in a insights on some low hanging fruits.
In this article, we try to bring following perspective:
- Economic disadvantages of the region
- Insights from State’s budget & GDP
- Key areas of development potential
- KEY ECONOMIC DISADVANTAGES OF THE JAMMU and KASHMIR REGION
- First, Smaller internal market limiting any economies of scale in production; no specific developments reducing the alternatives of scaling up production for exporting to markets outside the state.
- Second, higher unit costs of service delivery
- Third, restrictive legislatives compelling private sector to be on back foot, compounded with security concerns; which puts economic activity generating potential on the public sector.
- Fourth, low tax base with absence of the private sector
- Fifth, inadequate thrust on public capital expenditure.
- Finally, complacent state resource generations due to excessive and prolonged dependence on central assistance.
- INSIGHTS FROM THE STATE BUDGET AND ECONOMIC SURVEY
GDP Growth of state at constant prices vis-à-vis India:
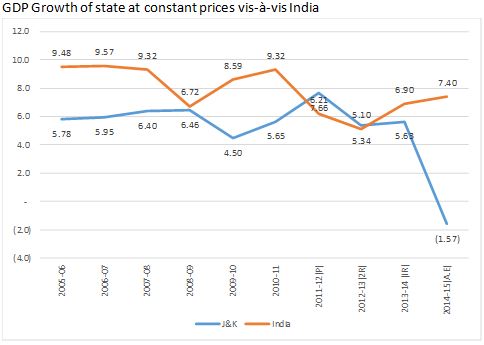

The above chart clearly shows that the J &K GSDP growth has always lagged the nations growth. Generally, the converse is true i.e. state GDP growth exceeds that of the state. The State GDP stood at Rs. 45126 cr., for 2014-15. The GSDP of J & K is less than its sister tiny state Himachal Pradesh. Contrary to everyone’s belief, about Tourism been the major GSDP source, the major GSDP contributors are:
- Agriculture at 14.35%
- Public Administration at 18.36%
- Other services at 13.74%
- Trade Hotel & Restaurant at 7.75%
- Manufacturing at 7.72%
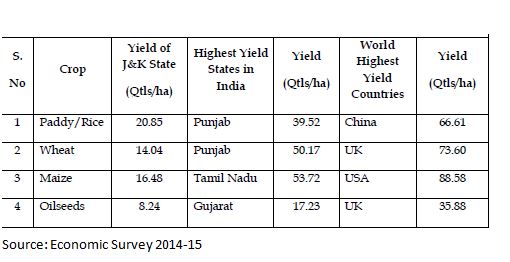
Despite agriculture contributing to high extent, the state is extremely backward with agriculture. Following table shows the extent of the same:

Having looked the components which sometimes seem very nice and shiny, I thought the best way to look at the State is having a looking at its Spending Pattern i.e. Spending of its tax revenues and the degree of support from the Center. To my surprise, the Centra has contributed more than 50% of the States’s Sources of Fund. In fact, during 2008-09 to 2010-11, the Centre’s contribution was ~66% of the revenue sources. Simply put if this money was not pumped in by the Centre, there would have no Spending by the Government.
One more Fun Fact, the State’s tax collection is so low, it wont even be in a position to pay salaries of the Government employees; so expecting any contribution to nation building is a fool’s dream.
Here’s a look at the Sources of Funds & Utilization of the State:
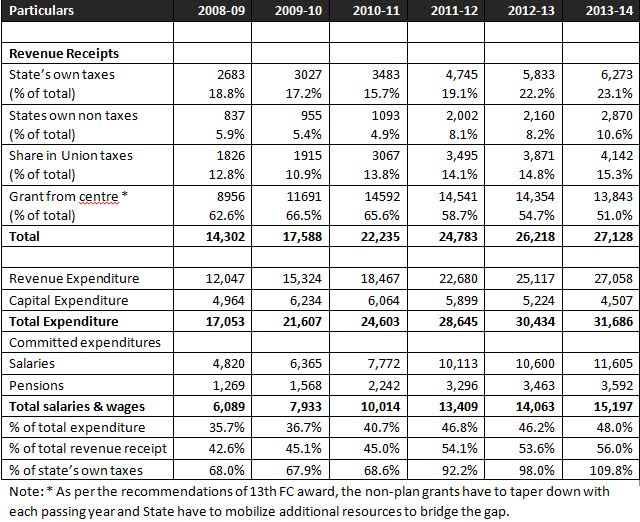

Note: * As per the recommendations of 13th FC award, the non-plan grants have to taper down with each passing year and State have to mobilize additional resources to bridge the gap.
The above table points to some glaring issues in fiscal management summarize as below:
- Low share of state’s own taxes, given no major industries or even any economic activity
- Heavy dependence on the centre, in fact, the grant from center is ~50% of the total revenue receipt.
- High share of revenue expenditure in the total expenditure.
- Very high share of salaries & pension in the state economic. In fact, the salaries are 48% of total expenditure, 56% of revenue receipt and 109.8% of Center’s grant.
- In fact, in the last three years the share of salaries as % of Center’s grant of more than 90% suggesting that if not for Centre’s the state would find it even difficult to run for 6 months.
Inefficiencies in expenditure
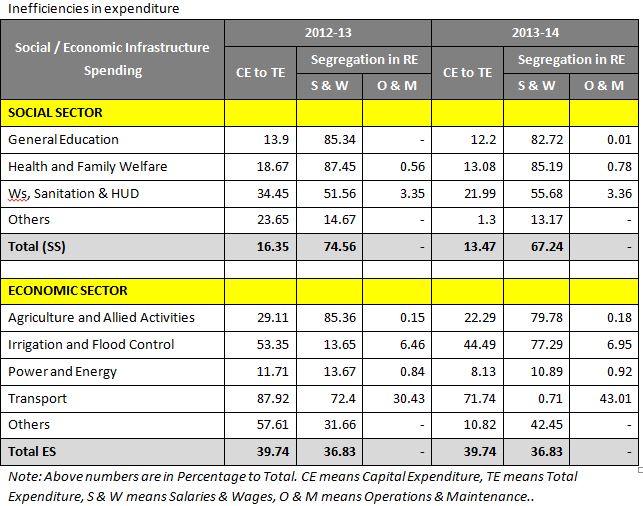

Note: Above numbers are in Percentage to Total. CE means Capital Expenditure, TE means Total Expenditure, S & W means Salaries & Wages, O & M means Operations & Maintenance..
A closer look at the above table suggest that in the Social Sector, ~74% of spending is on Salaries while only 16.3% is spent on building new assets. In fact, the overall spending on Operation & Maintenance is extremely low, which shows even existing assets are not maintained properly. The existing assets could mean, roads, schools, sanitation drains, etc., which fall in the purview
- SOME AREAS OF DEVELOPMENT
Power Sector
The T&D losses at the state are at 55%. These losses have actually come down from 72.37% in 2007-08. However, 55% of T&D losses are just abnormal. In 2004, CRISIL ranked the state lowest in Power Utilities survey. J&K has 14 hydroelectric power stations in operation with total installed capacity of 1474 MW (304 MW under the State sector and 1101 MW under the Central sector).
In fact, the estimated HydroPower potential of the state is 20,000 MW of which 16,475 MW is identified segregated as under:
- 11283 MW in Chenab basin,
- 3084 MW in Jhelum basin,
- 500 MW in Ravi Basin &
- 1608 MW in Indus basin
Of this potential of 16,475 MW, only 2813.46 MW i.e. 17% is exploited so far consisting:
- 96 MW in State Sector from 21 power projects,
- 2009 MW in Central Sector from 7 projects, and
- 5 MW in Private sector from 4 projects
Again the Centre share in power project is >75% of total power generation.
Road Network
The problem of connectivity in Jammu and Kashmir operates at two levels:
- the problem of road connectivity to J&K – the state is connected to the rest of the country through just one highway; and
- the problem of road connectivity within J&K – there is a huge disparity in the road density across districts in the state.
This disparity is particularly pronounced in the rural roads sector. The road density in J&K is probably the lowest in the country. It was bit difficult to find the latest statistics on the road density. The planning commission report was dated, however, the Uttar Pradesh Economic Survey 2014-15 had this nice table of the country’s road density. Accordingly, we see that J&K has terrible road network.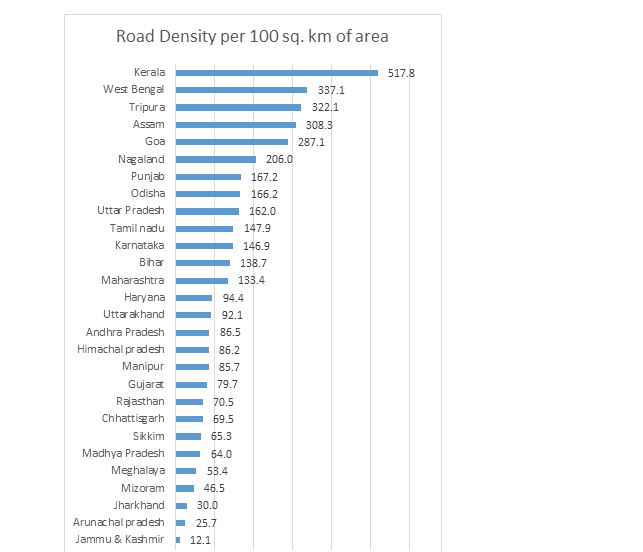

The industries scenario in the region is further pathetic. There are 29102 small scale units and only 83 large scale units; which employ 152651 people. The State had its first comprehensive investment policy in 2004; which is still under continuance & and extended up to 2017. It has some really good points like 100% excise refund, income tax exemption, stamp duty exemption, VAT exemption, pretty much everything is exempt, despite that the Industrial sickness and industries have never performed. As on 30 Nov 2014, there was just 53 Industrial Estates in J&K having an area of 31335 Kanals or 3916 acres.
Mines & Minerals
One more important point I wish to highlight is natural resources. The state has huge natural resources as enlisted below:
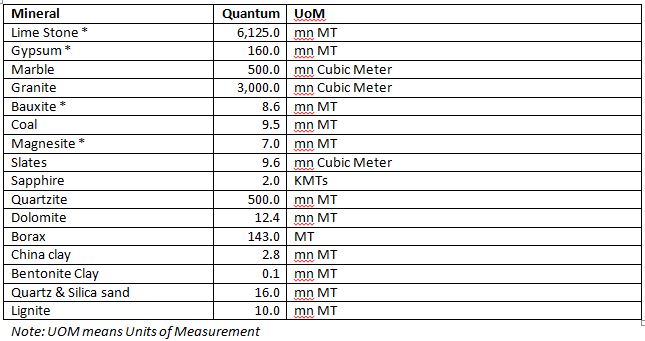

The above table shows mineral potential in the region; with items marked with “ * “ have an economic value of ~Rs. 345,155 crores; with Limestone the highest contributor in the said number. This is important, as the state’s GSDP is only Rs. 6273 cr.
In fact, every area there be it, medical or hospital, tourism, telecommunication infrastructure, or public distribution system, agriculture needs to be refocused and looked at vigorously. I believe the need is of DOERS over there rather than just GUIDERS. There needs to be dedicated task force willing to work and ensure everyone is drawn and connected to the task of rebuilding the State. The growth or oneness can never be achieved by divided hearts. My lines seem rhetorical, but the point I want to drive is Good Economics is Good Politics. The State and the Center need to work together. If the State is not working in line, it needs to be sidelined.
Probably, it is easier to the blame the predecessors. Frankly, I am of the opinion that there is no point blaming as it will not take us anywhere. If we want to rebuild the State; then power, road, natural resources and people are most important assets. The country as whole needs to invest and in fact, the State Budgeting activity needs to be relooked. If needed right professionals should be brought in.
The earlier task force had recommended development plan with an estimate of expenditure to the tune of Rs. 8500 cr. But, its been 10 years since that report. A reading the Economic Survey and the way the state spends its monies it is amply clear that this is not plausible. In fact, to draw a meaningful change, it is needed that ~INR 20,000 cr., be spent on Capital Expenditure of the state by the Centre directly. The word Directly, would mean contracts awarded for implementation from the Center and monitoring by a team from NITI AYOG and CAG.
The State’s youth need to aim to transform the region into Cradle of Growth rather than Cradle of Terrorism.
Source:
- Report of Task Force on Jammu Kashmir Development
- Economic Survey of 2014-15 of Jammu Kashmir
- http://ibm.nic.in/writereaddata/files/05232016120606avgvalueall_feb16.pdf
- http://ibm.nic.in/writereaddata/files/01192015114824IMYB_2013_Vol%20III_Gypsum%202013.pdf