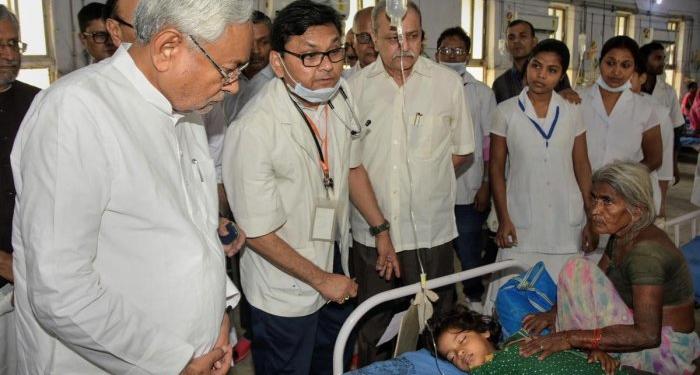
Encephalitis has grappled the state of Bihar with more than 150 deaths reported till date in 2019. Muzaffarpur district alone has witnessed more than 100 children dying due to this outbreak. This is not the first time Bihar is confronting this life-threatening disease. Hundreds of children died over the years, but the government is not equipped to tackle the epidemic. It happens mainly due to broken immune system, which fails to fight infection. Every state government has a health department. However, to maintain the good health of the people, not only the health department but water supply, sanitation and urban development as well as social welfare departments should act pro-actively and in accordance. Because proper sanitation and nutrition are two important pillars of good health, especially of children. Amidst the uproar over the question of adequate health facilities in Bihar, I attempt to analyze the performance of the major states of India.
I exclude smaller states like Goa as their administrative and demographic situations are completely different. I choose not to include the Union Territories (UTs) as central government intervenes significantly in their affairs. I keep aside Jammu & Kashmir as it has got a different constitutional provision, altogether. In short, I omit small, extra-ordinary states and UTs to make my analysis consistent. In order to reach to a coherent set of candidates (states), I set population of the state as the parameter. I include only those states whose population is more than 2 crores as per Census 2011. There are 18 such states, also this criterion automatically removes the small and exceptional states and UTs from the list.
Data on receipts and expenditure are taken from CAG finance accounts. The comparison is done for the year 2016-17, as this is the latest year available across the states. State population data are drawn from Census 2011. It is assumed that the population increase over the years after 2011 is uniform across states, so overall ranking does not change. Telangana population corresponding to 2011 is gathered from its Wikipedia page. Infant Mortality Rate (IMR) and Total Fertility Rate (TFR) data for 2016 are bagged from NITI Aayog. The table below shows the state-wise indicators along with its relative rank, which is stipulated in parenthesis.
Traditionally, researchers take health and family welfare department expenditure as the benchmark for health care facilities in a state. However, this is not appropriate, given the fact that prevention is the core of the health system. In this regard, the government expenditure on sanitation and nutrition becomes unarguably important. To assess the actual health care situation of a state, I define a new indicator called as ‘Health Expenditure’, which constitutes expenditure on health and family welfare, water supply and sanitation, and nutrition. The comparison of states on different indicators is done on per capita basis to normalize the differential population effect across states. Telangana is the best-performing state, whereas Bihar is the worst on this parameter (per capita health expenditure). The much-touted state of Kerala for its social sector expenditure lies at eighth spot. Interestingly, Rajasthan secures the second position.
Not only in health expenditure but the state of Bihar rests at the bottom in all the indicators in consideration. Per capita total expenditure is the lowest for Bihar. Punjab tops the list followed by Telangana. The state performance based upon per capita total receipts almost mirror it (per capita total expenditure), which is obvious as the state which earns more, can spend more. Own Tax Revenue, which comprises taxes on sales and trade, land revenue, stamp and registration fees, state excise, taxes on goods and passengers (before the introduction of GST), and others, constitutes a significant proportion of the total receipts. The shares of own taxes in total receipts for the industrial states of India, Maharashtra, Karnataka and Gujarat are closer to 50% or more than that.
Interestingly, Punjab, which is at the top in per capita total receipts, comes at second last in the share of own taxes. The reason behind is its huge debt burden. A state can enhance its income to spend more or can borrow for higher spending. Huge borrowing is unsustainable in the long run. Fortunately for states like Bihar, Goods and Services Tax was introduced in 2017. This is a destination-based tax, so the tax revenue of higher consumer states is expected to increase. But the question arises, will it be enough to fund required expenditure for the state of Bihar? Will the overall health facilities be the priority of the government?
The lower health care spending results in poor social indicator for the state of Bihar. It secures 12th spot in IMR ranking and has highest TFR. As evident in the table, there is a high positive correlation between IMR, and TFR. Tamil Nadu is the second-best state with respect to IMR and the best state as per TFR. Uttar Pradesh is at 15th and 17th mark with respect to IMR and TFR respectively. The conclusion is that if the probability of survival of children is lower, people tend to have more children. When infant mortality rate goes down, the fertility rate will go down as well. To increase health as well as total expenditure in the state, Chief Minister Nitish Kumar should look for new income sources. Enough of status quo, Bihar needs rapid industrialization.
Table: State-wise Comparison of Per Capita Receipts, Expenditure and Social Indicators
State | Per Capita Total Receipts (in Rs.) | Share of Own Tax Revenue in Total Receipts | Per Capita Total Expenditure (in Rs.) | Per Capita Health Expenditure (in Rs.) | IMR (per 1000 Live Births) | TFR (Births/Woman) |
Andhra Pradesh | 32587 (3) | 27% (12) | 33754 (3) | 2323 (3) | 34 (11) | 1.7 (3) |
Assam | 17029 (15) | 23% (16) | 18396 (14) | 1786 (11) | 44 (16) | 2.3 (11) |
Bihar | 12218 (18) | 19% (18) | 12133 (18) | 847 (18) | 38 (12) | 3.3 (18) |
Chhattisgarh | 23230 (8) | 32% (8) | 23144 (9) | 2221 (6) | 39 (13) | 2.5 (13) |
Gujarat | 22819 (9) | 47% (3) | 22469 (11) | 2300 (5) | 30 (8) | 2.2 (10) |
Haryana | 32214 (4) | 42% (5) | 33551 (4) | 2312 (4) | 33 (10) | 2.3 (11) |
Jharkhand | 16422 (16) | 25% (15) | 17995 (15) | 1427 (14) | 29 (7) | 2.6 (14) |
Karnataka | 26924 (7) | 50% (2) | 27731 (7) | 2183 (7) | 24 (5) | 1.8 (6) |
Kerala | 29872 (5) | 42% (4) | 32954 (5) | 2150 (8) | 10 (1) | 1.8 (6) |
Madhya Pradesh | 21197 (12) | 29% (9) | 21575 (12) | 1522 (12) | 47 (18) | 2.8 (16) |
Maharashtra | 22672 (10) | 54% (1) | 22865 (10) | 1446 (13) | 19 (3) | 1.8 (6) |
Odisha | 20396 (13) | 27% (13) | 20662 (13) | 1913 (10) | 44 (16) | 2 (9) |
Punjab | 47505 (1) | 21% (17) | 48101 (1) | 1395 (15) | 21 (4) | 1.7 (3) |
Rajasthan | 22562 (11) | 29% (10) | 23647 (8) | 2411 (2) | 41 (14) | 2.7 (15) |
Tamil Nadu | 29096 (6) | 41% (6) | 28851 (6) | 1988 (9) | 17 (2) | 1.6 (1) |
Telangana | 36311 (2) | 38% (7) | 38024 (2) | 3667 (1) | 31 (9) | 1.7 (3) |
Uttar Pradesh | 16256 (17) | 26% (14) | 16687 (17) | 986 (17) | 43 (15) | 3.1 (17) |
West Bengal | 17375 (14) | 29% (11) | 17393 (16) | 1266 (16) | 25 (6) | 1.6 (1) |
India | 34 | 2.3 |
Sources: State Finance Accounts for 2016-17 – CAG, NITI Aayog, Census 2011.


