The IIP or the Index of Industrial Production (IIP) is an index for India which shows growth or trend of various sectors in an economy such as mining, electricity and manufacturing. The IIP Index is like a pre-cursor to assessing GDP growth or how the industries are performing on a month to month basis. It is compiled and published monthly by the Central Statistical Organization (CSO) six weeks after the reference month ends.
The IIP value represents the represents the status of production in the industrial sector. The base year was at one time fixed at 1993–94 so that year was assigned an index level of 100. The current base year is 2004–2005. The Eight Core Industries comprising ~38 % of the weight of items include Electricity, steel, refinery products, crude oil, coal, cement, natural gas and fertilizers. Thus, performance of these industries are key to understanding overall growth. The IIP index thus shows the performance of Economy.
Second important indicator is CPI or Consumer Price Index is a Retail inflation indicator. It measures what is the degree of inflation directly impacting the end-consumer vis-a-vis WPI or Wholesale Price Index which impacts companies. These two measures are keenly watched by both Policy makers and Central banks for policy and interest rate decisons.
India’s macro-economic indicators painted a mixed picture as retail inflation decelerated sharply to a five-month low in August after breaching the central bank’s tolerance level of 6% in the previous month, thus opening a window for policy rate cut later this year while factory output shrank in July.
The Consumer Price Index (CPI) declined to 5.05% in August from 6.07% in July as food prices stabilized. The CPI number is well below consensus economist estimates of 5.5%. and sharply below the RBI tolerance level of 6%; creating hopes for rate cut in the month of Oct 2016.
One more healthy data point coming from Ministry of Agriculture is that 105.4 mn ha is already been sown under multiple Kharif crops till date, resulting in a 4.16% y-o-y increase in the area sown. Further, the pulses sowing (having a high retail inflation sensitivity) is up 30% y-o-y to 14.4 mn ha. This information coupled with better monsoons, is expected to lead to better crops & control in food inflation. All these factors combined can lead to the economy moving to the 5% CPI target for Mar 2017 or probably lower in the months to come.
IIP Contracts due to base effect
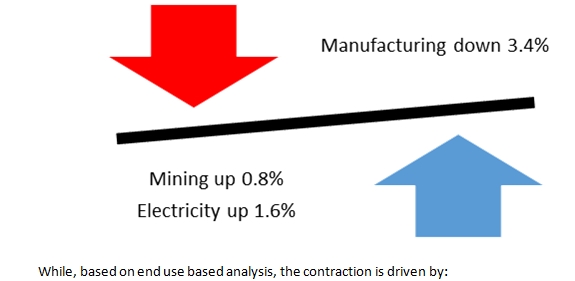
The General Index for Industrial Production (IIP) has contracted by 2.4% y-o-y for the month of July 2016. Further, for the period from Apr to Jul 2016, the IIP has contracted by 0.2%.
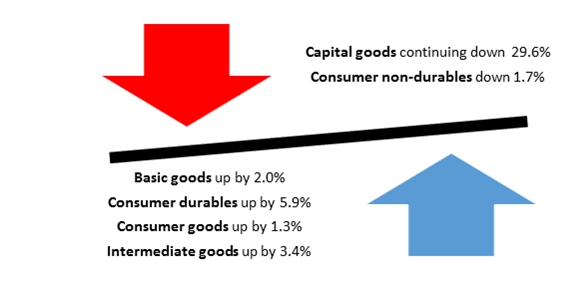
The sector-wise contribution to the IIP decline is driven by:
This fall in IIP has seasonality; in fact, there is base effect in play. The following chart shows the IIP index trend since Apr 2009. Look at the Maroon Color Box and trend. Generally, from Apr to Sep, the Index is in a similar range. This range continuous for a year or two. In fact, between Apr to Sep 2009 the index moved sharply to higher side in Apr to Sep 2010. This was followed by similar increase in Apr to Sep 2011. However, the index then stabilized and remained in this range from Apr to Sep 2014. After nearly four years, in Apr to Sep 2015 there was uptick in the index move.

Brownie points for the Government shall be their ability to keep the index stable here in the wake of global uncertainty / or ensure there is increase in the overall index in the ensuing months.
If we look at the index, there are cracks in the manufacturing sector which is taking time to heal.
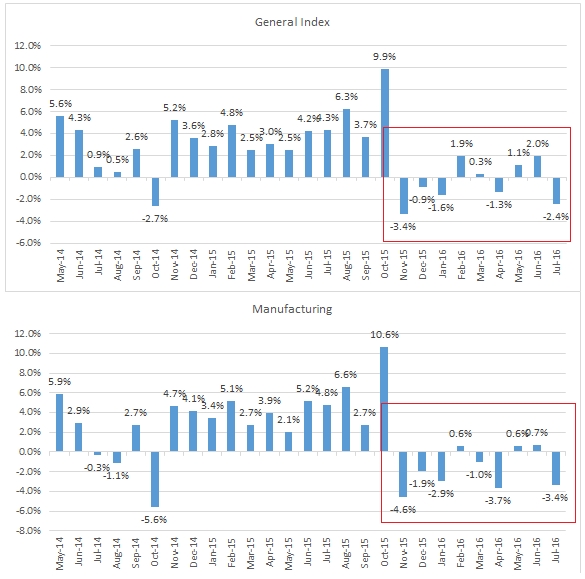
The movement as shown in the above chart is primarily stable; but the key is getting that increase. So, I would not worry on the 2.4% contraction, yet.
However, one item that remains worrying is the capital goods sector. This index is seeing monthly decline and there is need to arrest the bleeding here.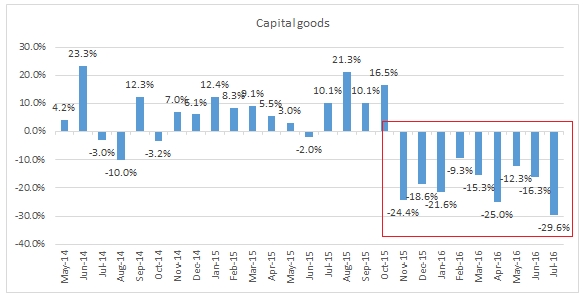
The Government needs to step up on the Public Capital Expenditure which shall be key in reviving the Capital Goods sector. Further, on the back of better rains, increasing sowing and easing inflation, RBI should consider a rate cut of at least 50 BPS to ease liquidity constraints. Many analysts & economists have echoed in for a rate cut. We believe we may see a 50 BPS rate cut in the month of OCT 2016.
Source:
http://mospi.nic.in/Mospi_New/upload/iip_12sep16.pdf
http://mospi.nic.in/Mospi_New/upload/cpi_pr_12sept16m.pdf


