RBI paper on bank mergers: Banks. The term connotes different realities to different individuals. While for commoners like us, it refers to a place for deposits and loans, for experts it is a brief snapshot of the bigger economic picture. They view banks mainly in two categories. Small banks and large banks. Small banks are mainly required when national economies need a liquidity push from commoners. If that is successful, nation states strive towards having bigger banks.
These bigger banks ultimately turn into global banking platforms, mainly benefiting the country which they are headquartered in. In the last few years, India has found itself in the middle of it. India has a duty to secure minimum banking benefits to its population, and at the same time, we have to plan for the future. In this context, mergers of banks to form a bigger one becomes crucial.
RBI paper on bank mergers
Recently, the Reserve Bank of India published a report on mergers of banks in India. We have downloaded the RBI paper on bank mergers from RBI’s website. It is titled “Do Bank Mergers Improve Efficiency? The Indian Experience”. The RBI paper on bank mergers report looks at the experience of the mergers in India happening after 2022.
Authors mainly looked at 15 financial ratios. These ratios cover liquidity, profitability, operating efficiency, capital adequacy, asset quality and NPA provisions. While the fate of banks merged in the initial years of post-liberalisation period are well known, people are curious to understand the impact of recent mergers by the Modi government.
Need for merger
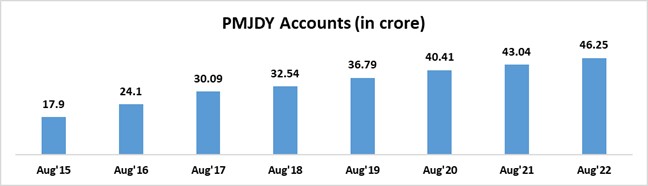
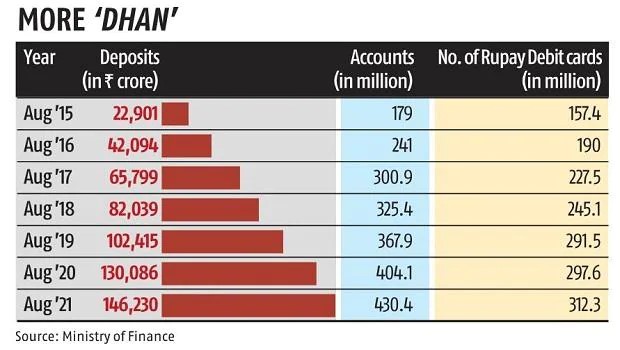
As extensively reported by the TFI, in 2019, 10 public sector banks (PSBs) were merged into 4, bringing down the total number of PSBs from 27 to 12. There were many reasons behind it. For instance, the presence of a large number of PSBs had not remained a foremost necessity in 2019. Primarily because, the Jan Dhan Yojana introduced by PM Modi had started to do its magic. Total number of Jan Dhan Accounts was close to 37 crore in the month of August, 2019.
These accounts cumulatively held Rs 1,02,415 crore Rupees. Mind you, these numbers were just a mere formality as one would assume from the fact that it is merely poor villagers putting their small savings in Jan Dhan accounts. The fact is that Jan Dhan Account holders have been given enough avenues to break free from the bureaucratic shackles of not being able to take out their own funds on time. When the merger was taking place, 75 per cent of Jan Dhan Account holders had their own debit cards.


After the brief rush of opening accounts, Jan Dhan Accounts along with Rupay Card reduced the need for people to visit banks for minor stuff. For people lying on the fringes of the economic pyramid, other reasons for visiting banks include depositing money in their accounts and taking loans. While crowding due to deposit will take time to sort out, over the last few years plenty of avenues for easier credit have opened up. These include legitimate loan apps, NBFCs and some government backed options too.
RBI paper on bank mergers – PSBs were suffering
Apart from diminishing needs, PSBs legacy issues also became reasons for merger. Before the sudden acceleration in work ethic due to JAM trinity and demonetisation, PSBs just worked for the sake of working. Very few of them had resolved to improve efficiency. Their officers mainly used to loan big businesses, rather than serving the poor.
Their loan portfolio, in fact, almost tripled from Rs 18,19,074 crore as on 31 March 2008 to Rs. 52,15,920 crores on 31 March 2014. To hide their failures, they did not even classify them as NPAs, until RBI tightened the norms. Despite that, losses continued to mount up. Between FY16 and FY20, these banks cost Rs 2,07,329 crore to the state exchequer.
To add insult to injury, credit lending was getting tougher for them, worsening the chances of correcting their past mistakes. In addition, bigger banks find it easy to adhere to Basel III norms. To give some perspective, during the time of merger, PSBs in India had a dismal market capitalisation of Rs 5 lakh crore.
That is the poor backdrop in which the decision to merge was taken. Bank mergers are in line with recommendations of highly credible documents like PJ Nayak Committee report and M Narasimham Committee report.
With the merger, government strived to achieve lower cost of operations, more financial inclusion, broadening geographical reach of both the acquirer and acquiree banks, availability of bigger scale of expertise, lesser burden on government for recapitalisation, abolition of redundant posts, finance large projects, increase competitiveness and technological synergy. To put it simply, the merged entities were supposed to be more efficient.
Merger was built on strong fundamentals and people liked it too
To check whether these merged entities attained the desired level or not. Researchers checked both past and present of acquirers and acquirees. The word past here means the period 3 years before the merger and by present researchers refer to either the end of 2022 or 2 years after the merger. Firstly, it was checked whether the bank which acquired another was more technically efficient or not. Look at the following chart. If you find it tough to maintain focus, just look at the last column.

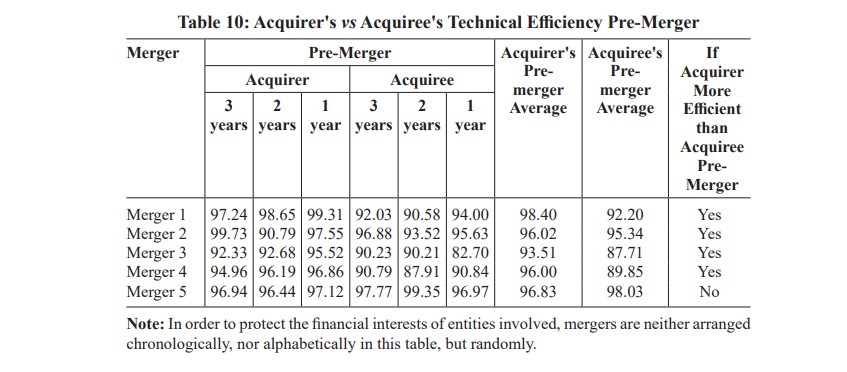
5 mergers had taken place and in 4 of them, a less-efficient public sector bank was acquired by the more efficient one.
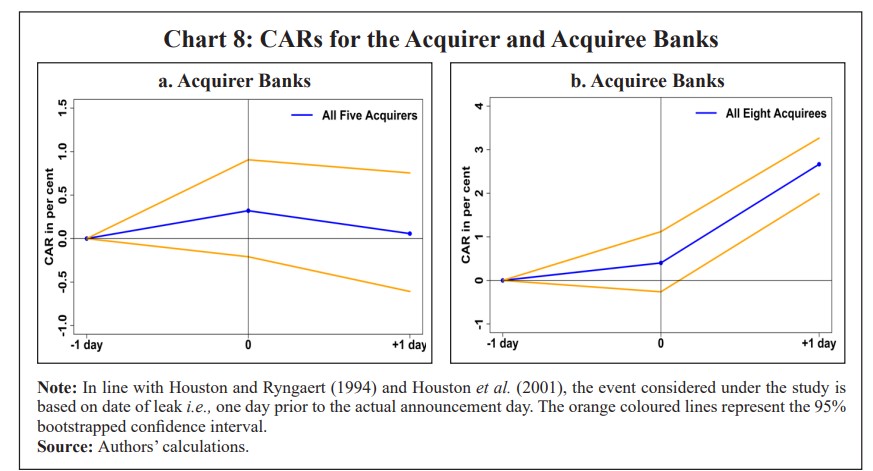
The markets confirmed this fact too. For shareholders of efficient banks, it is a bad strategy if an efficient entity buys a less efficient one. Similarly, for shareholders of inefficient banks, it is good news if a bigger player has come to rescue their banks. Generally, such kind of news turns into abnormal returns for shareholders of both acquirer and acquiree.
Researchers found out the sum total of all such abnormal returns, a day before and after the news about mergers were circulating. The following chart shows a steep decline in returns for acquirers while, for shareholders of less efficient banks, it was the day of bounties.

Significant increase in key financial ratios
The enthusiasm was not short-lived. For next two years, the new entities left no stone unturned in overhauling the working culture. Resultantly, key ratios like CRAR, RoA, RoE, cost-to-income ratio, GNPA, NNPA and NPA provisions witnessed a remarkable uptick for most of them.
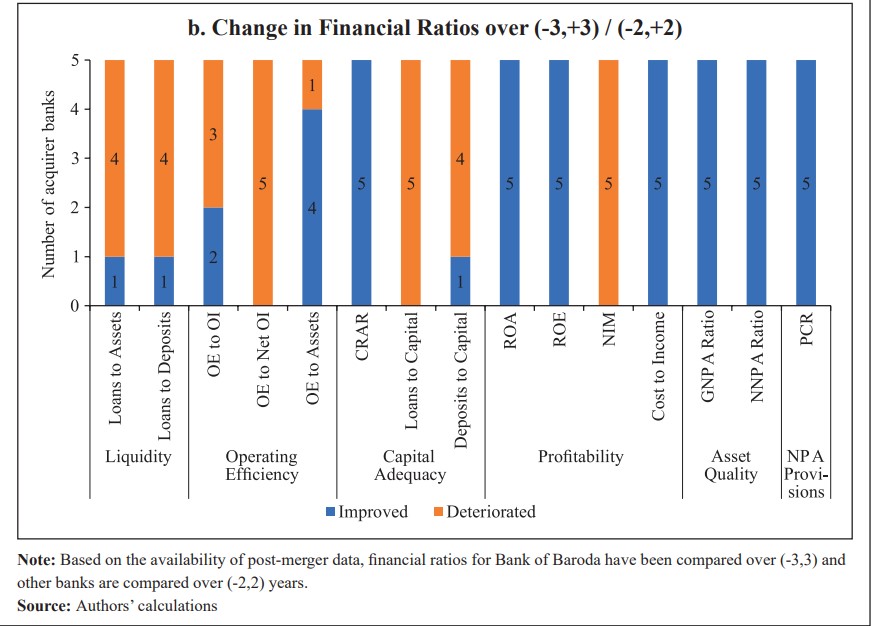
Here are two charts which depict this change. The first chart refers to the change observed within the period of 1 year. It has been compared with the same ratios existing 1 year before the merger. The second chart reflects the changes observed within 3 and 2 years before and after the merger.
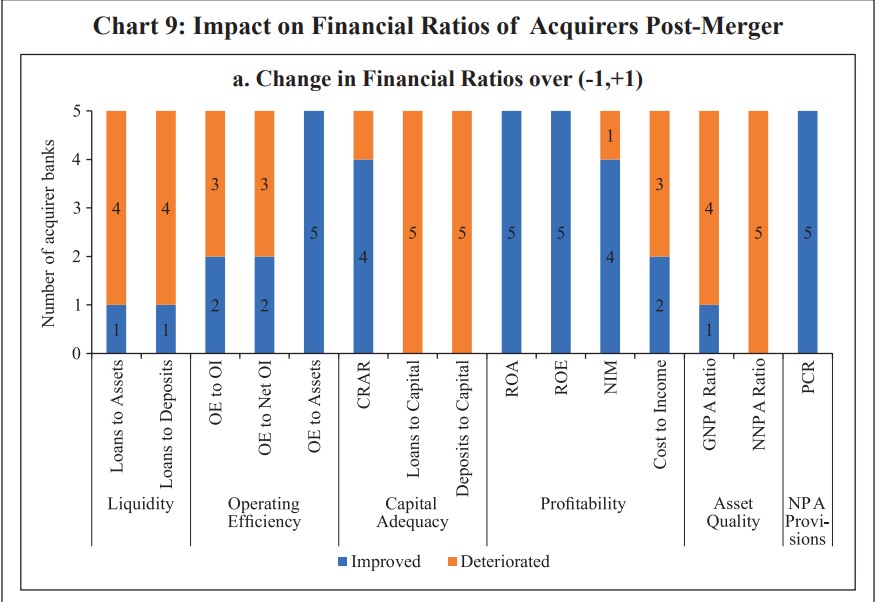


It is pertinent to note that the authors checked whether the influence of industries to which different banks cater to brings any impact or not. The authors said, “results are consistent across most of the metrics even after adjusting for industry-wide influences.”
Technical efficiency is mixed bag
By now, these charts would have made it clear that the changes were unprecedented. It can only mean one thing and that is change in technical efficiency. After proving that key financial metrics improved, the authors looked into the technical efficiency aspect of the mergers. 3 out of 5 acquirers witnessed a significant change in their technical efficiency. That is true for 2 years after the merger.
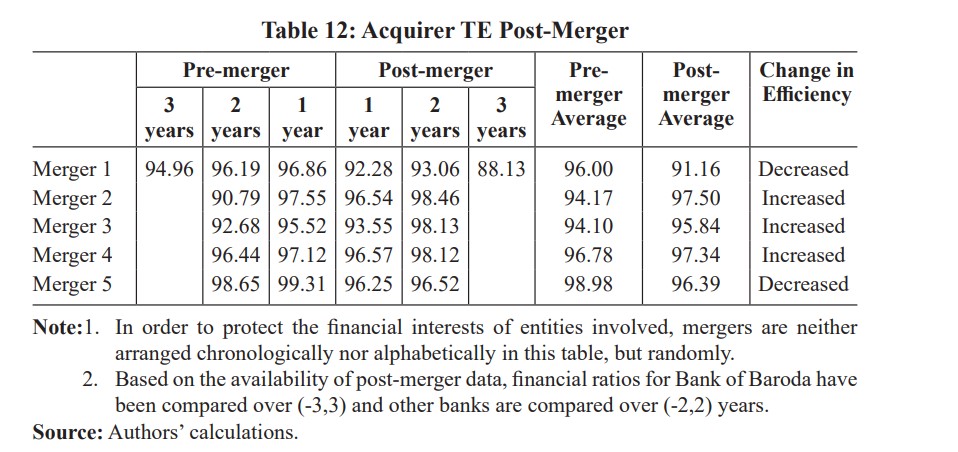

At this point, it is pertinent to note that improvement in technical efficiency of newest mergers is not as good as it was seen after the 1997 round of mergers. In that merger, average efficiency had increased from 90.88 to 93.80 in 3 years. That feat looks tough to achieve given that decline in average efficiency of Bank of Baroda is dragging the whole number back.
Judging on easily available metrics
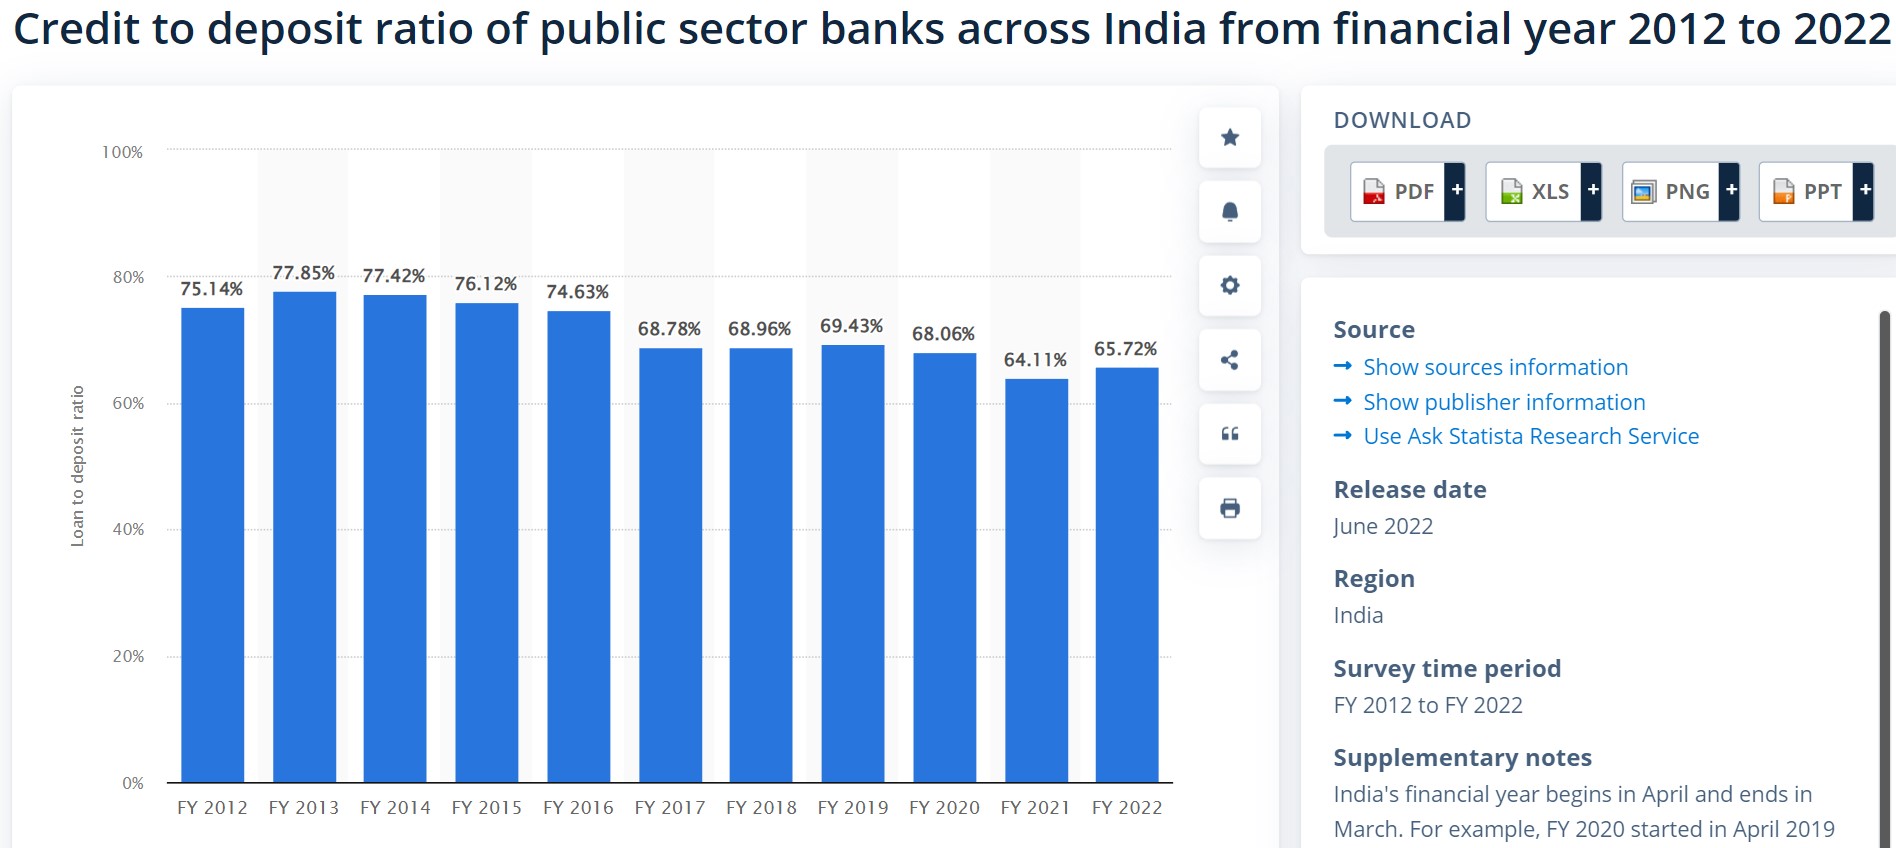
Despite that flaw, it is no short of achievement. Banks’ performance on other metrics, not so closely related to academic jargons, also stand as strong testament to it. We have data available for 2 financial years after the merger, FY21 and FY22. After a brief blip in covid-hit FY21, credit to deposit ratios of banks have significantly increased.

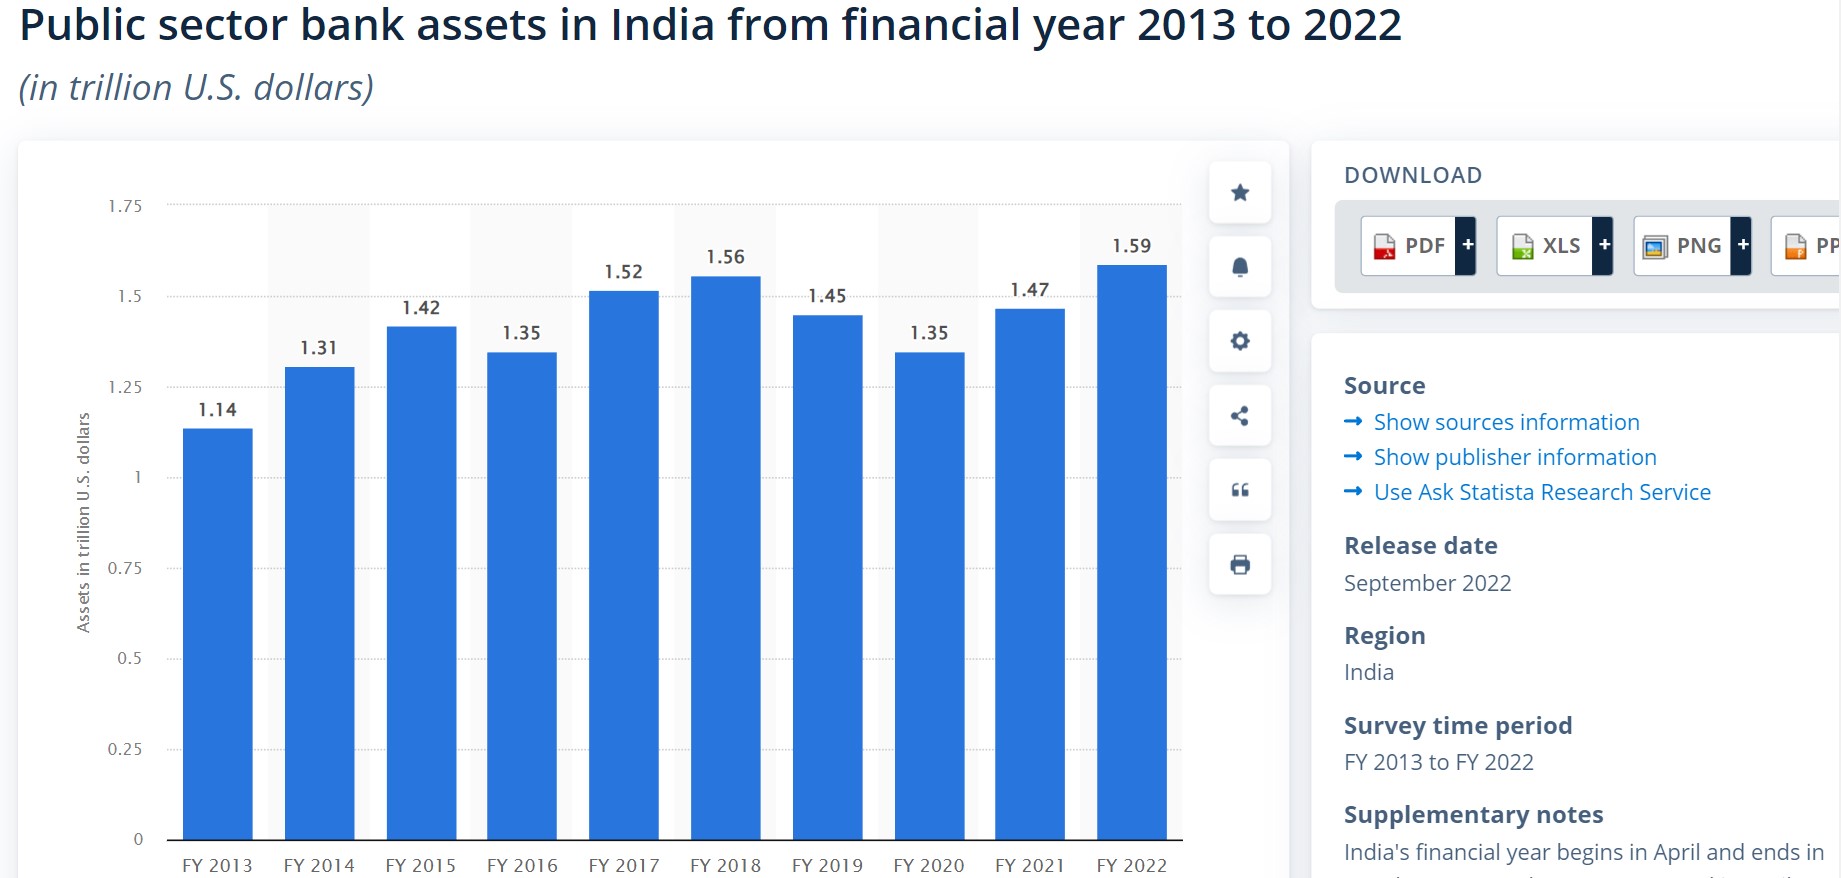
Remarkably, both loans and deposits witnessed an uptick. The increase in deposits meant that in FY22, assets held by public sector banks were highest in history. It was at a historic high of Rs 1.6 trillion.

Even the old scourge called NPA does not look a threat now. During the last 7 years, PSBs have recovered Rs 6.42 trillion worth of NPAs. Gross NPA is on decline and this is the reason why profitability and lending are increasing. In only 2 quarters of Financial Year 2023, 12 PSBs have earned a cumulative profits of nearly Rs 41,000 crores.
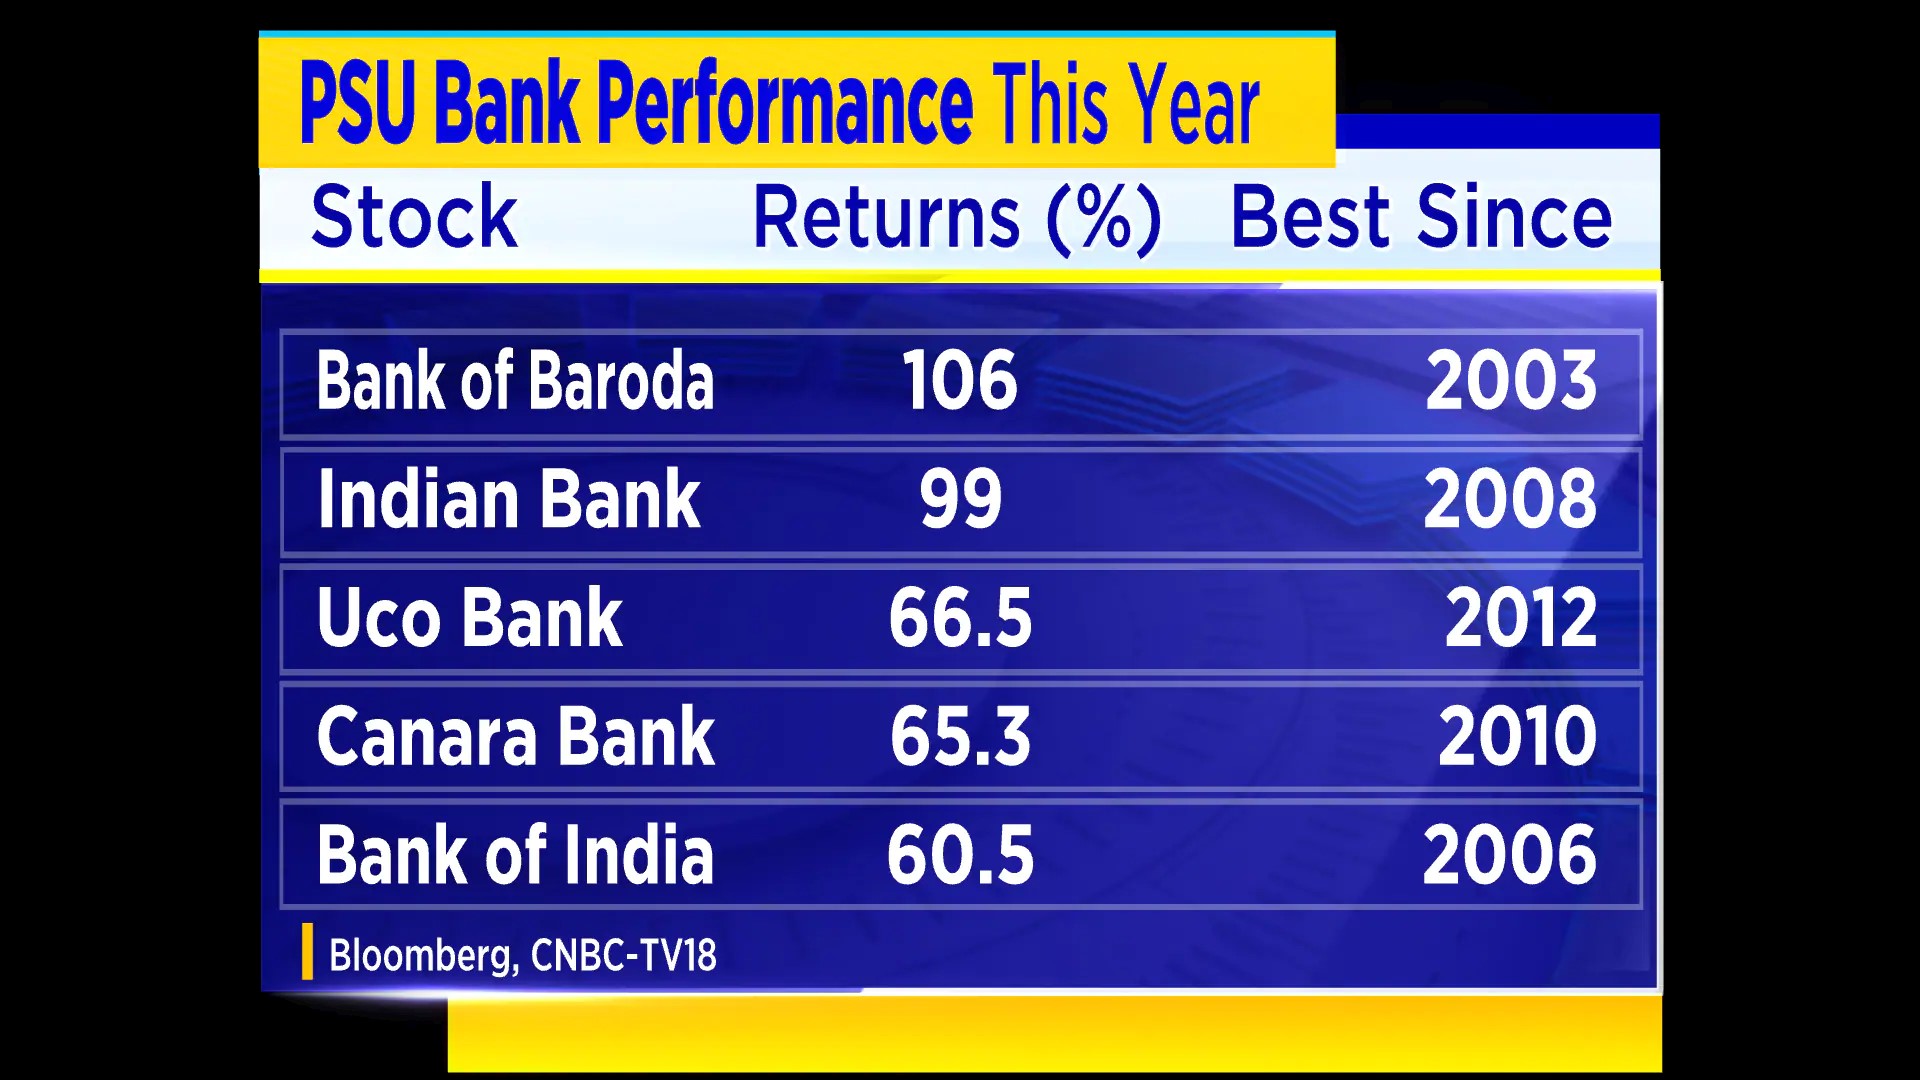
In November last year, market capitalisation of PSBs crossed Rs 10 lakh crore for the first time. 50 per cent of it was occupied by SBI, once a subject of meme for us Indians. Even the share of PSBs in lending has jumped up to 54.8 per cent of total loans distributed in India. The lending by PSBs is expected to increase significantly in FY 24. All of this has resulted in positive public sentiments and shares of PSBs have increased significantly.

Amidst these encouraging numbers, stakeholders should not forget that big banks do not end up becoming too big to fail. Other risks like being more vulnerable to problems of globalisation and destruction of the idea of decentralisation are also there. Only time will tell whether India will produce a Lehman Brother of its own or the thriving HSBC.
Support TFI:
Support us to strengthen the ‘Right’ ideology of cultural nationalism by purchasing the best quality garments from TFI-STORE.COM
Also Watch: