
The Spectator Index [1], a very influential handle popular for the facts and figures it tweets, sent out a message to its 820 k followers on the hard power equations of the world. In that tweet, it’s called out the military power ranking of the world, with India straddling a very impressive fourth place, ahead of two P5 (UN security council permanent member) countries but behind the big three, US, Russia and China.
https://twitter.com/spectatorindex/status/1069422803923873796
The report did generate some media buzz, but an important fact most of the reports seemed to miss, is the source of the rankings that lent it credence. The very interesting thing about the tweeter in question, is that it is highly opaque. It is not based on an established media house brand, or on a think tank which churns out analyses of rigor. Why then, are its figures valuable? It is so because they do a fantastic job of curating data sets from very solid sources and providing a credible collection of data from a range of powerful number crunchers, from some well-established sources to obscure but keenly watched ones. Specifically, in the case of the index of military power what the spectator index brings forth, is a list from an equally impenetrable provenance, the global firepower website [2]. The global firepower index has been publishing since 2012, and over the years, has come to be widely cited in many well-known think tanks. [3][4] Although the exact methodology for ranking is not well known, what they do is to combine technology and size to give a holistic view of the conventional military power. That is, they subscribe to the paradigm of “quantity has a quality of its own” while at the same time suitability factoring in advancements in weapon platforms. It also, factors in whether a country has a sea board, or does it not need a navy and does not penalize a land locked country. Therefore, they provide a comprehensive view considering different facets that go into projection of hard power.
An interesting aspect of the global firepower report is that it does not merely publish a ranking, but it creates a cumulative power. What it does is create a weighted average value for each country based on several different elements that participate in fighting potential. Thus, it calls out not only how the countries stand relative to each other, it also gives the distance between the different runners in the race. There ratings are based against a scale where 0 is the perfect power ability, and a higher power number means the country is weaker. If one was to look at its figures published over the years a trend analysis of the same would be quite revealing. However, an interesting aspect of this website is that they have not chosen to display the numbers they had put out in the previous year, and their website only has the latest data available at any point of time. We therefore need to rely on other sources on the interweb who thankfully had captured most of the global firepower data in the previous years in the process of publishing their own articles on the same. We are therefore in a position to carry out study on how the different countries have done over the year in comparison to each other.
Naturally, centered as we are around our country, our comparative analysis would run focused on us. To that end, lets first examine the data of some of the countries which are of interest to us along with our own. These would of course include Pakistan and China, our immediate large neighbors, and the countries from which we share the greatest threat perception. To this mix, we need to consider both US and Russia as they have continued to remain the traditional military heavy weights over the years since second world war despite the crumbling of the Soviet Union and are also in the top five along with India. The sole superpower of the day also provides the reference to the data as its heft can have taken to have remained stable over the years, a little like what its currency the dollar does. The other country we should consider is the UK, this is because of two reasons. First UK provides the proxy measure for all older colonial powers, whose primacy was built on loot and resource extraction, and second, due to its specific historical relationship with India in the previous context. While we can look at other countries to examine different contexts, say Eastern Asia power map, or G20 capabilities, or West Asian power equations. This current set spans over Asia, Europe and Americas and includes the main players and is fairly globally representative.
The following table is the historical global power index data gathered from a variety of primary and secondary sources [5-11] This lists the power rating number, as also the rank of Pakistan in the list (in brackets). In this data the big four, US, China, India and have continued in their respective positions over the years, while UK (rank not listed in the table) has fluctuated over the years, with ranks ranging from 5th to 7th.
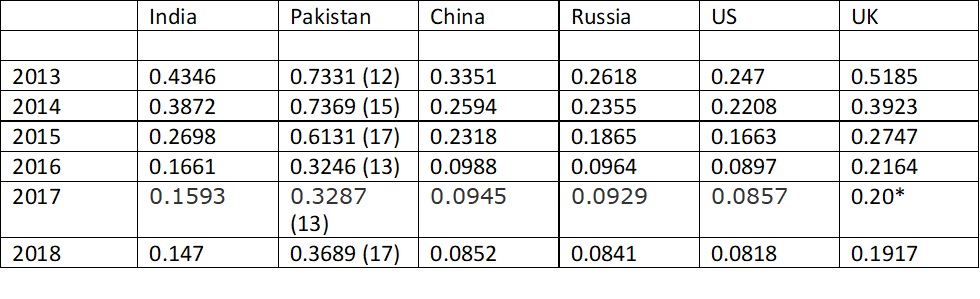

- For one, while the relative positions for most of the countries has fluctuated over the years, the big four have continued solidly in theirs, almost as if they were a completely different set living on a different planet and the factors affecting the rest of the countries did not mean much to them.
- The other trend that we see that countries have been improving their score, even as their relative positions may or may not have changed, the overall scores for each country has broadly improved. This essentially means, that growth in warfighting capabilities are being continuously pursued, even as economic growth feeds this overall capability.
Let it be clear then, that the world still pursues the strength of arms, and any spin on the world becoming safer or more peaceful or moving away from militarization is an exceedingly foolish canard being spread by loonies of left-wing persuasion fattening themselves off others money in well-funded public universities.
- Pakistan, for its supposed hyphenation with India, has never really stood anywhere close to India. Its best time, when it had been closest to where India stood, had been in 2013, and over the years the distance has only grown.
While we are able to get top trends from the data, to make a finer grained analysis, we would need to not just look at the ratings by themselves, but also do a comparison of the numbers with respect to India, as well as see how that distance has changed over the years. To this end, let us examine the ratio of different countries power index with respect to India over the years. We need to also calculate, how much as that ratio changed since 2013, as that number gives us a succinct estimate of the difference in respective standings over the course of 5 years. This data is presented in the following table.
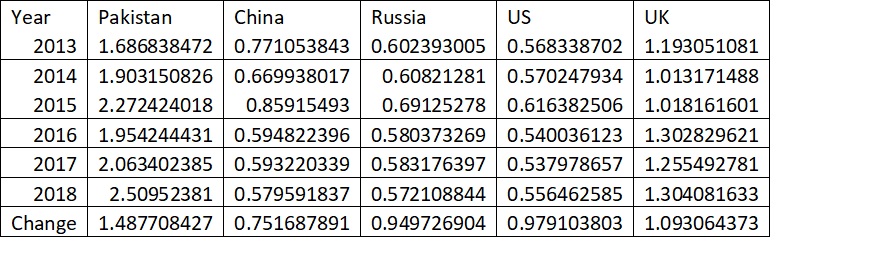

At this point of time, details in the patterns begin to emerge, and let’s look at those now. For the sake of simplicity, we will assume that the ratings are a linear scale, that is a score of 1 is twice as powerful as a score of 2 for the purposes of this measurement. Of course, a logarithmic or exponential approach would change the power distance significantly, but still the broader trends would hold.
- India and US have largely maintained their respective distance from each other. US had continued to be about twice as powerful as India over the period under study.
- The maintenance distance has been largely true with respect to Russia too, although there, Russia has made a slight improvement.
- United Kingdom has been consistently falling behind India with the gap increasing, and over the years is now additionally 10% behind from where it was.
- China though has pulled ahead of us, as they are 25% more powerful compared to where they were against us.
- The biggest and the most dramatic change though, has been in the case of Pakistan, where not only have they fallen behind India over last 5 years, they have done so dramatically. The gap between India and Pakistan has increased by 50% over last 5 years. There was to be honest, never any comparison, but now even the pretense of one has become laughable. In fact, Pakistan is one country, where the gap has started growing rapidly again over last couple of years after its attempt to close the gap before.
While the numbers have been quite telling in themselves, as they say a picture speaks a thousand word, and the same analysis can be easily seen visually by plotting these as in the graph that follows.
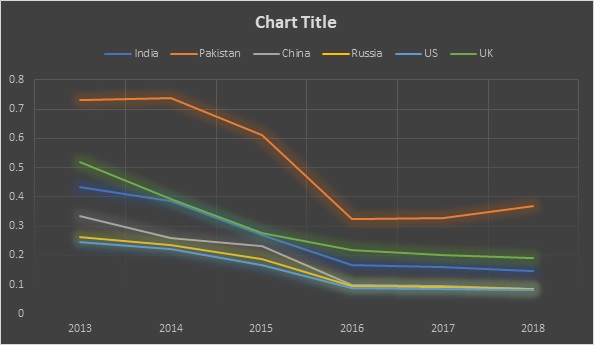

This is easy visual depiction of all above gives additional takeaways,
- US, Russia and China, although maintaining their relative positions, are now very close to each other to be nearly indistinguishable.
- Visually speaking, India has been narrowing the gap and moving in lockstep in the group of big 4.
- Pakistan is completely disconnected from the countries at the top of the table and its trajectory is clearly headed the wrong way
While we need to see what the future brings, the extrapolation of the graphs points to an ever-increasing disparity between the military haves and have nots, and this is only likely to dramatically grow with the rich becoming richer and poor falling off.
Welcome to the multi-polar world people.
- [Spectator Index] Link
- [Global Firepower] Link
- [A Survey of Indices Measuring Geopolitical Power] Link
- [Indicators focusing on hard power] Link
- [Global FirePower Index 2013] Link
- [Global FirePower Index 2014] Link
- [Global FirePower Index 2015] Link
- [Global FirePower Index 2016] Link
- [Global FirePower Index 2017] Link
- [Military power, 2017] Link
- [Military power, 2018] Link